Inside QBTS's open-interest positioning gate: 66 trades, a failed drawdown limit, and a trailing benchmark
What the open-interest pressure gate watches, when it enters and exits, and how it performed across 66 QBTS backtest trades: a failed drawdown gate and a benchmark it trailed by 550 pp.
This note presents a backtest of a rule-based open interest positioning regime strategy applied to QBTS. The test covers a period in which the overall market was mixed and the positioning signal was drifting. The note walks through the strategy mechanics, the entry and exit conditions, and the key metrics from the backtest record. It also covers the conditions under which the strategy underperformed.
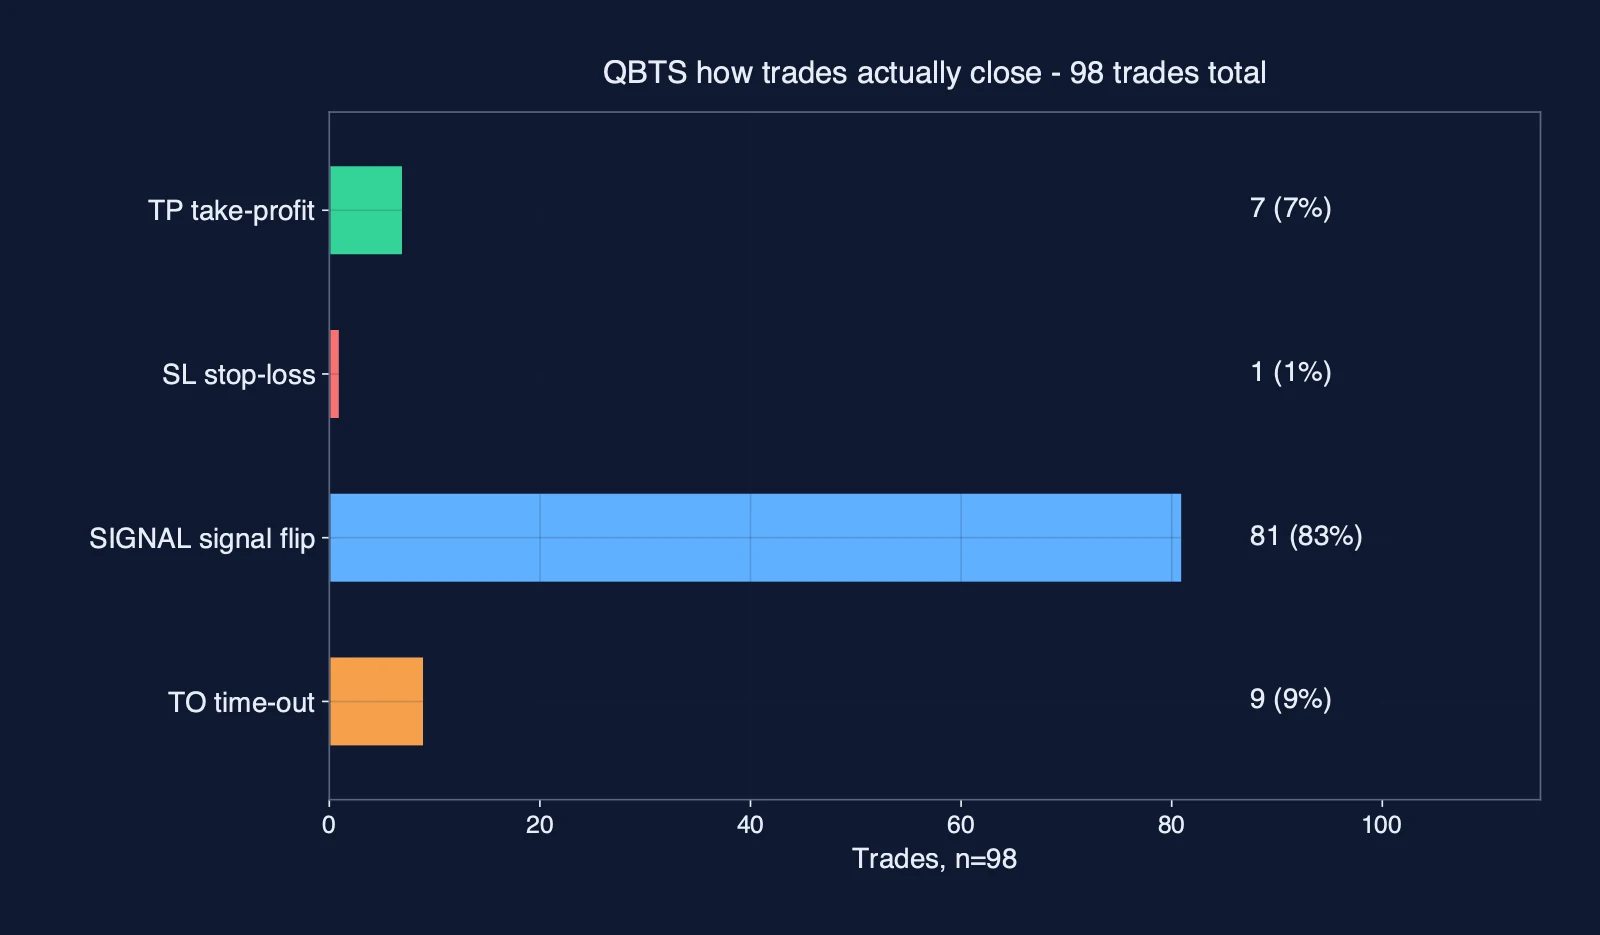
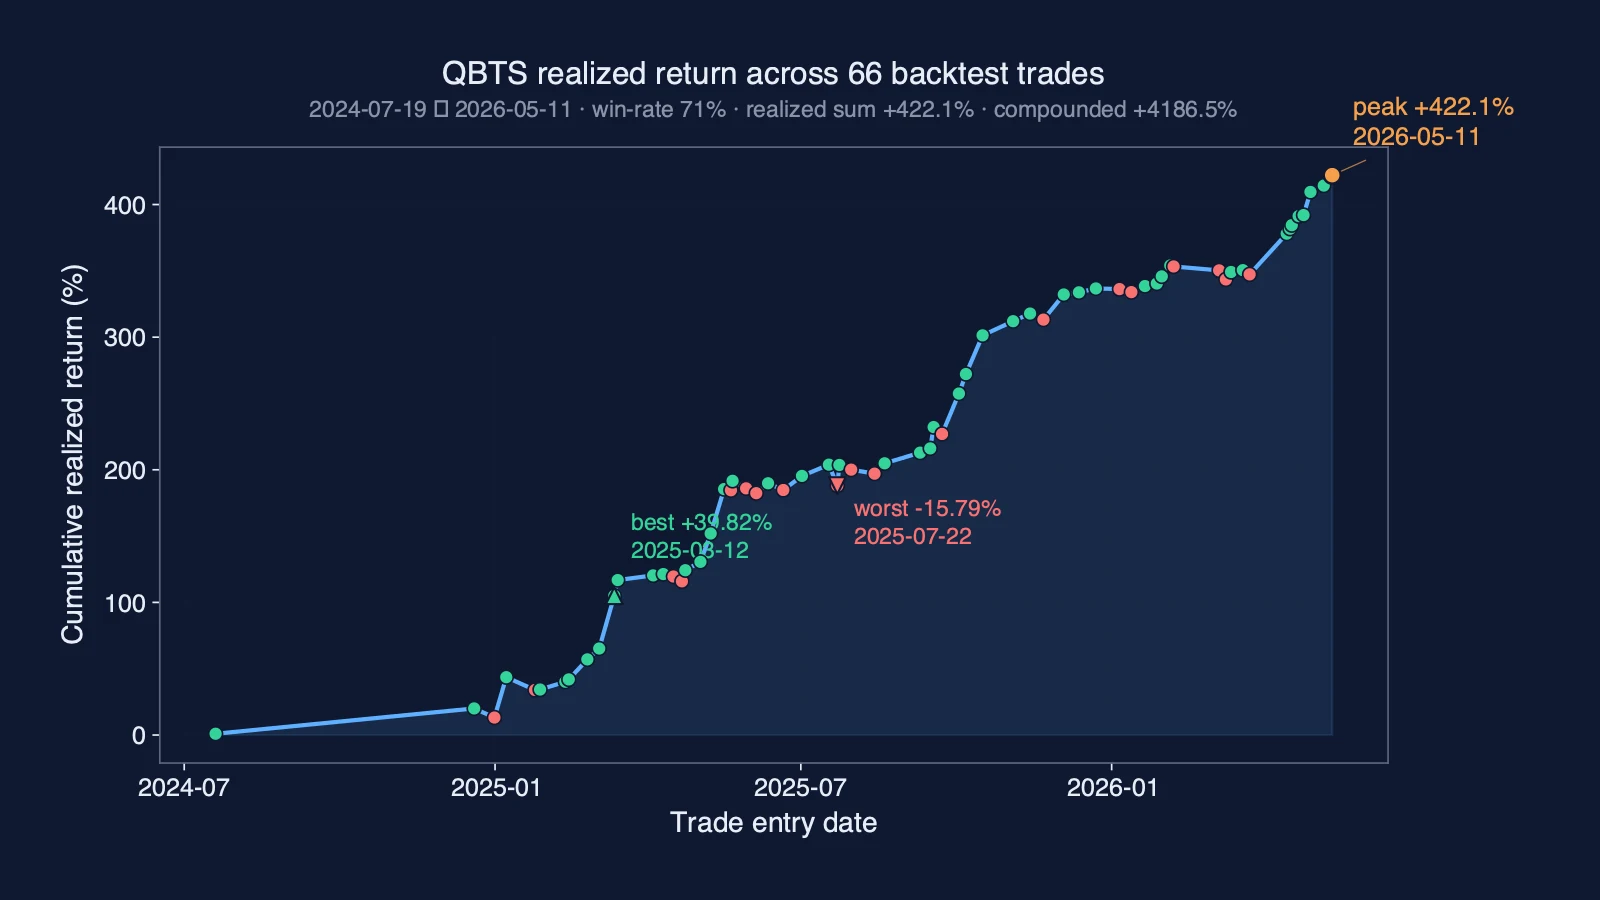
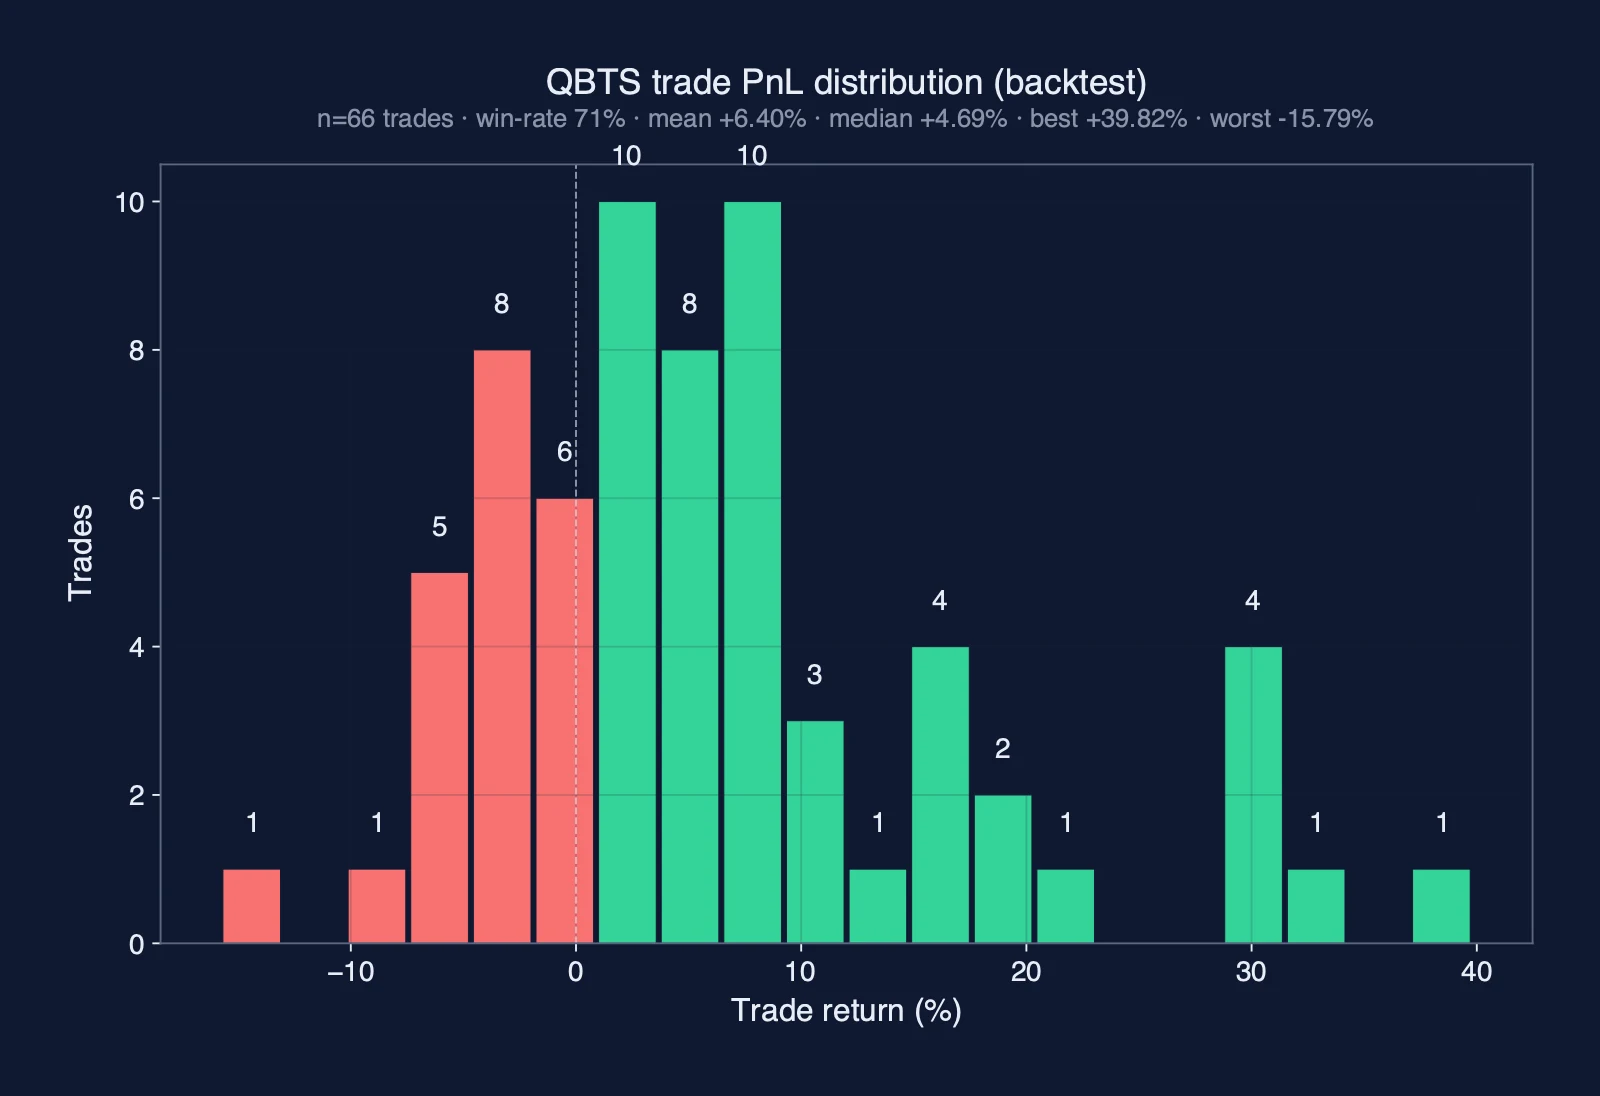
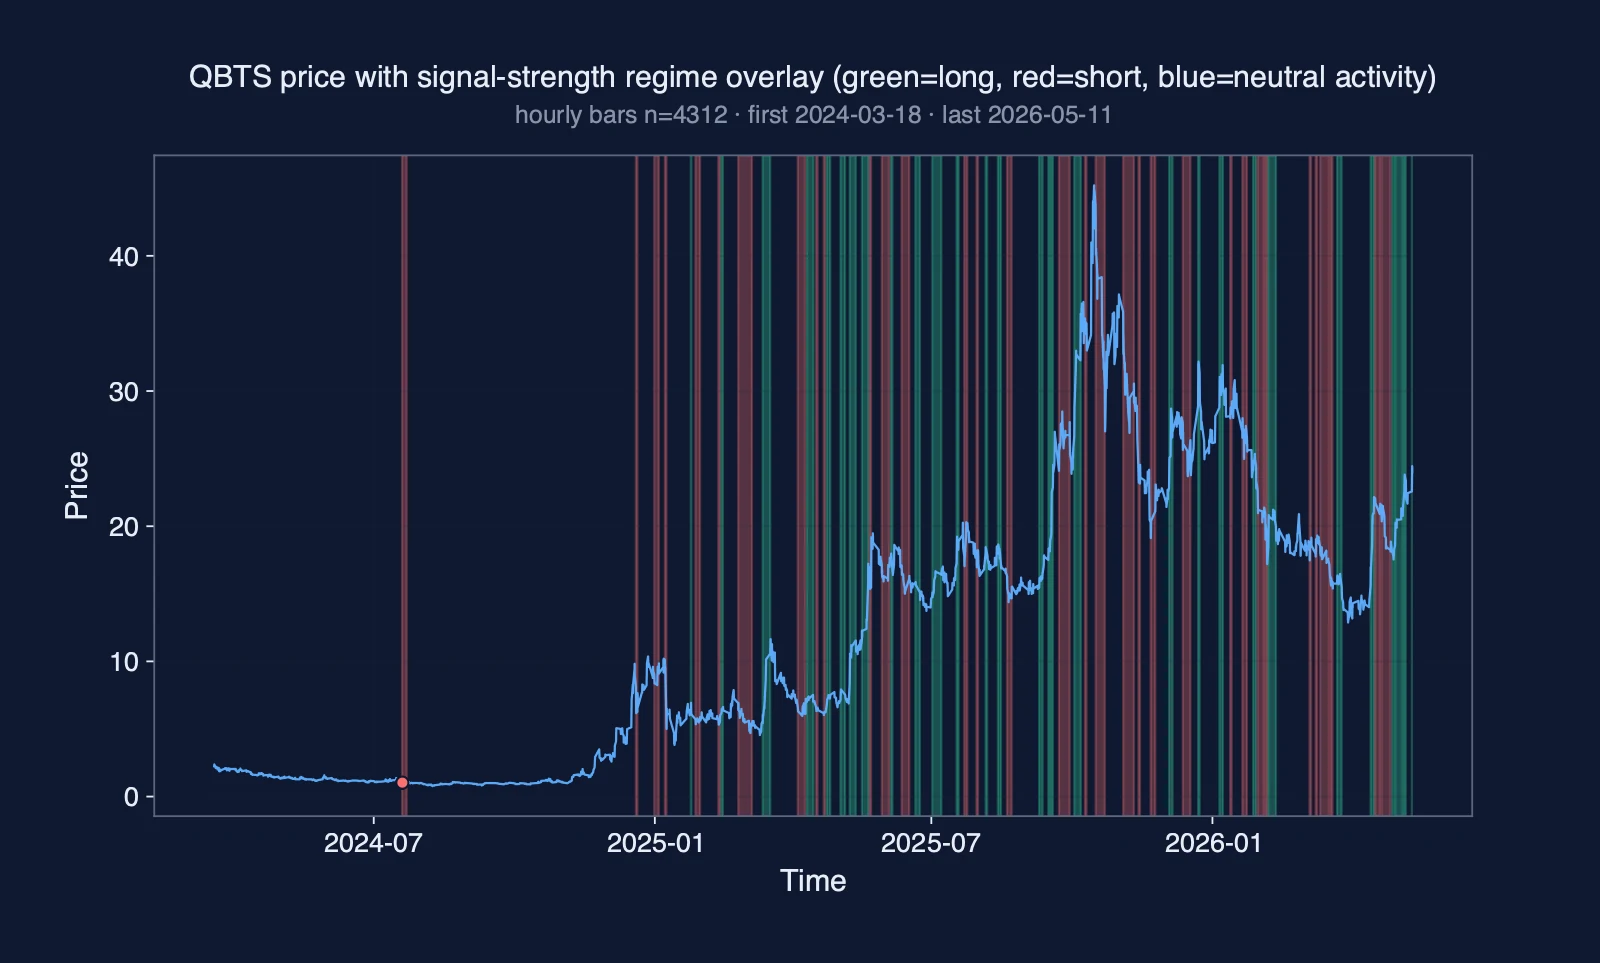
Inside QBTS's open interest positioning regime, a two-condition pressure gate decides when capital moves: both inputs to the open-interest pressure calculation must agree at the same time before any trade opens. Direction then follows the model's bullish, bearish, or neutral read, a long when the read tips one way, a short when it tips the other. Most exits are signal-driven, closing the moment that read switches off; the remainder close on a fixed time limit, a profit target, or a stop. The verified win rate across a compact trade count sits in strongly positive territory, even as the current backtest alignment reads as drifting, a reminder that the strength of the QBTS setup here lies in a precise entry gate and a defined exit structure, not in discretionary judgment about direction. By the close of the historical replay, this QBTS rule sat at 66 attempts with a 71% strike-rate.
How the model is built, end to end
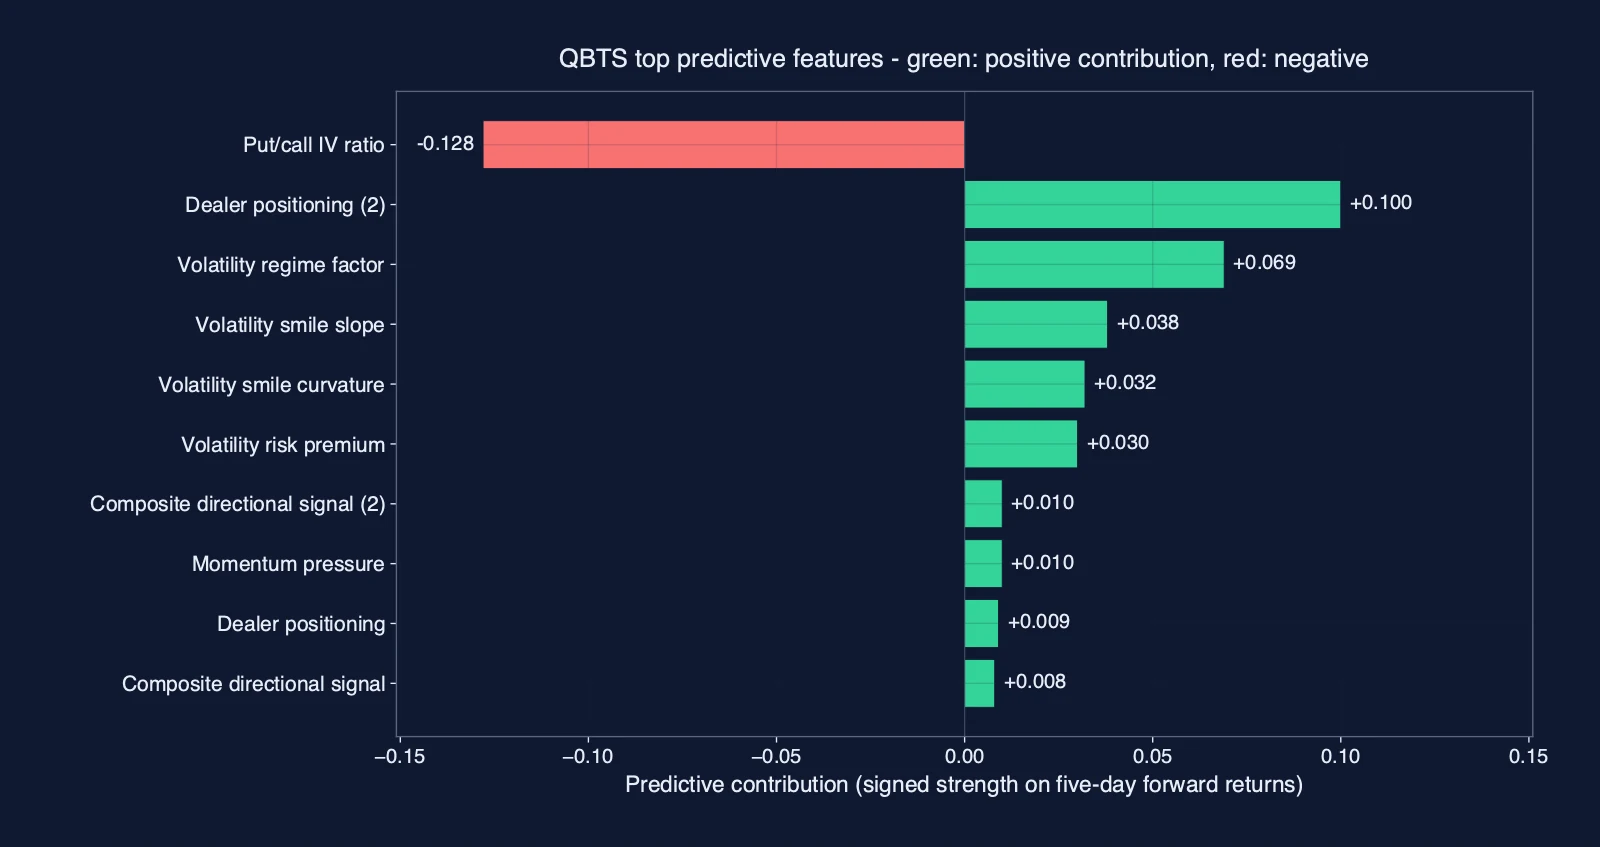
The model's raw material is open-interest data. This is a running measure of the standing open contracts on QBTS positions across derivatives markets. It updates continuously as new contracts are opened and old ones are closed. From that stream, the pipeline finds a pressure signal. It shows whether participants as a whole are leaning harder into one direction or quietly pulling back. When that pressure builds steadily on one side, the model reads a directional regime taking shape. When it stalls or reverses, the read shifts accordingly. Before any trade fires, that reading must pass a paired-condition gate. Both inputs must agree at the same moment. A single condition clearing its threshold is not enough. The model stays flat through a good deal of noise that would trigger a simpler system. Once both conditions align, the model's bullish, bearish, or neutral read sets the direction. A position then opens long or short. Most exits are signal-driven. When the open-interest pressure regime switches away from the entry read, the position closes. The remainder end on a fixed time limit, a profit target, or a protective stop. That caps how far or how long a position can run if the regime takes longer to resolve than expected.
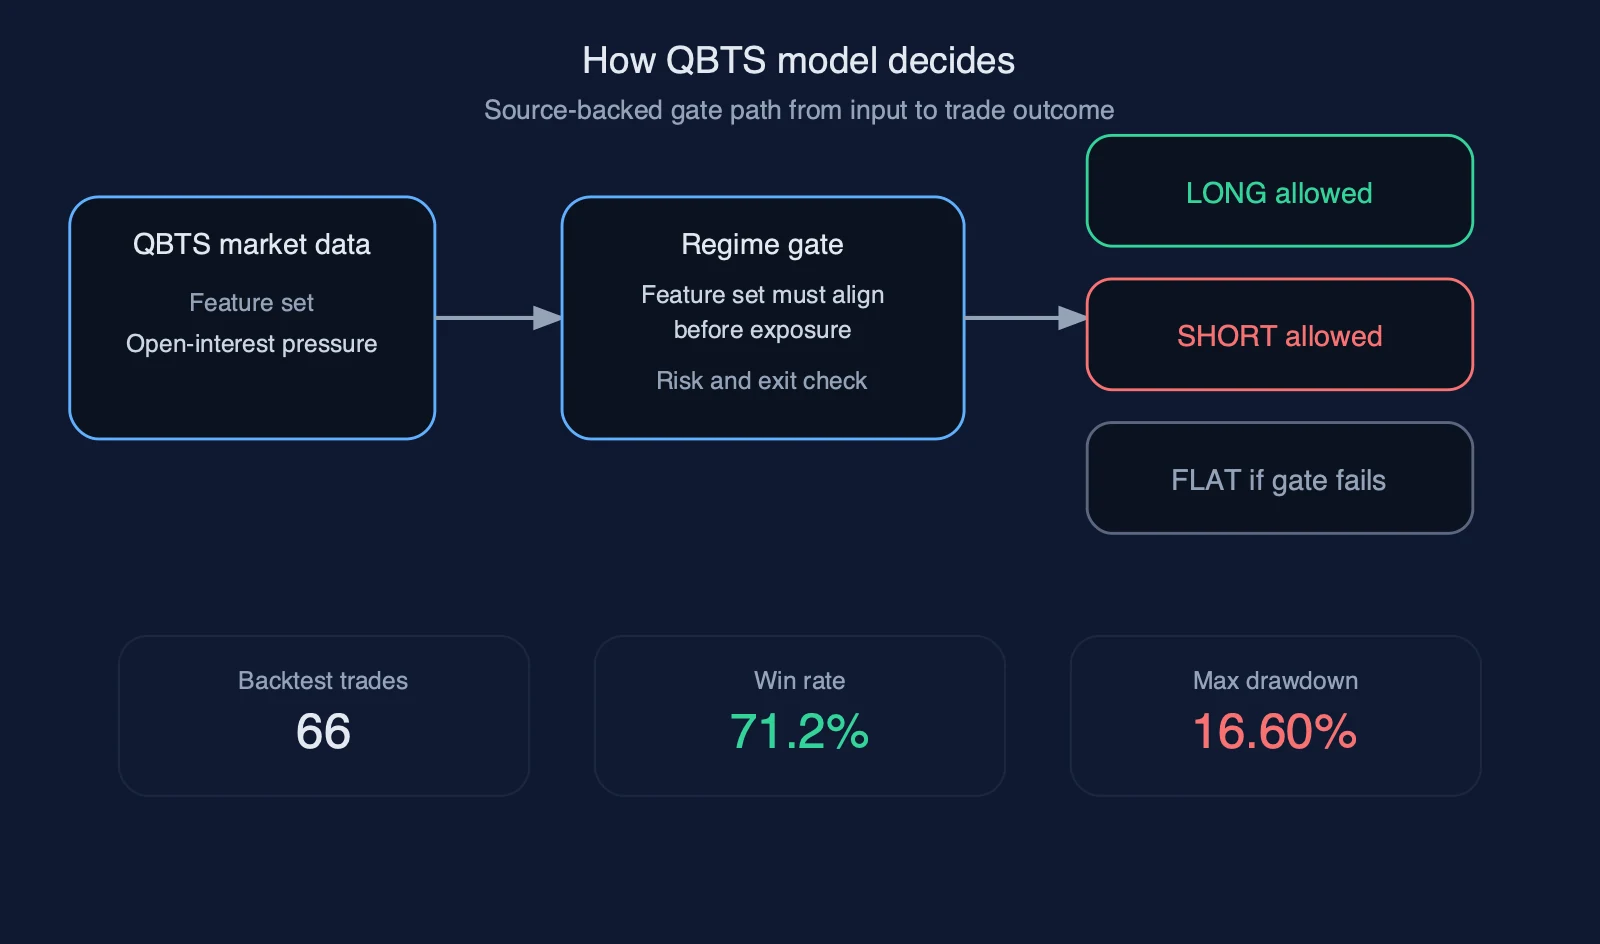
The model's edge on QBTS does not come from watching prices and reacting faster than others. It comes from the upstream steps that filter for specific open-interest pressure conditions before any trade is considered. The benchmark comparison at the right answers the only question that matters. The question is whether that disciplined selection process actually produced better outcomes than simply holding the asset. (See the lineage diagram above for the full chain from idea to package to deployment.)
At a glance
| Gate | Actual | Threshold | Status | Threshold source |
|---|---|---|---|---|
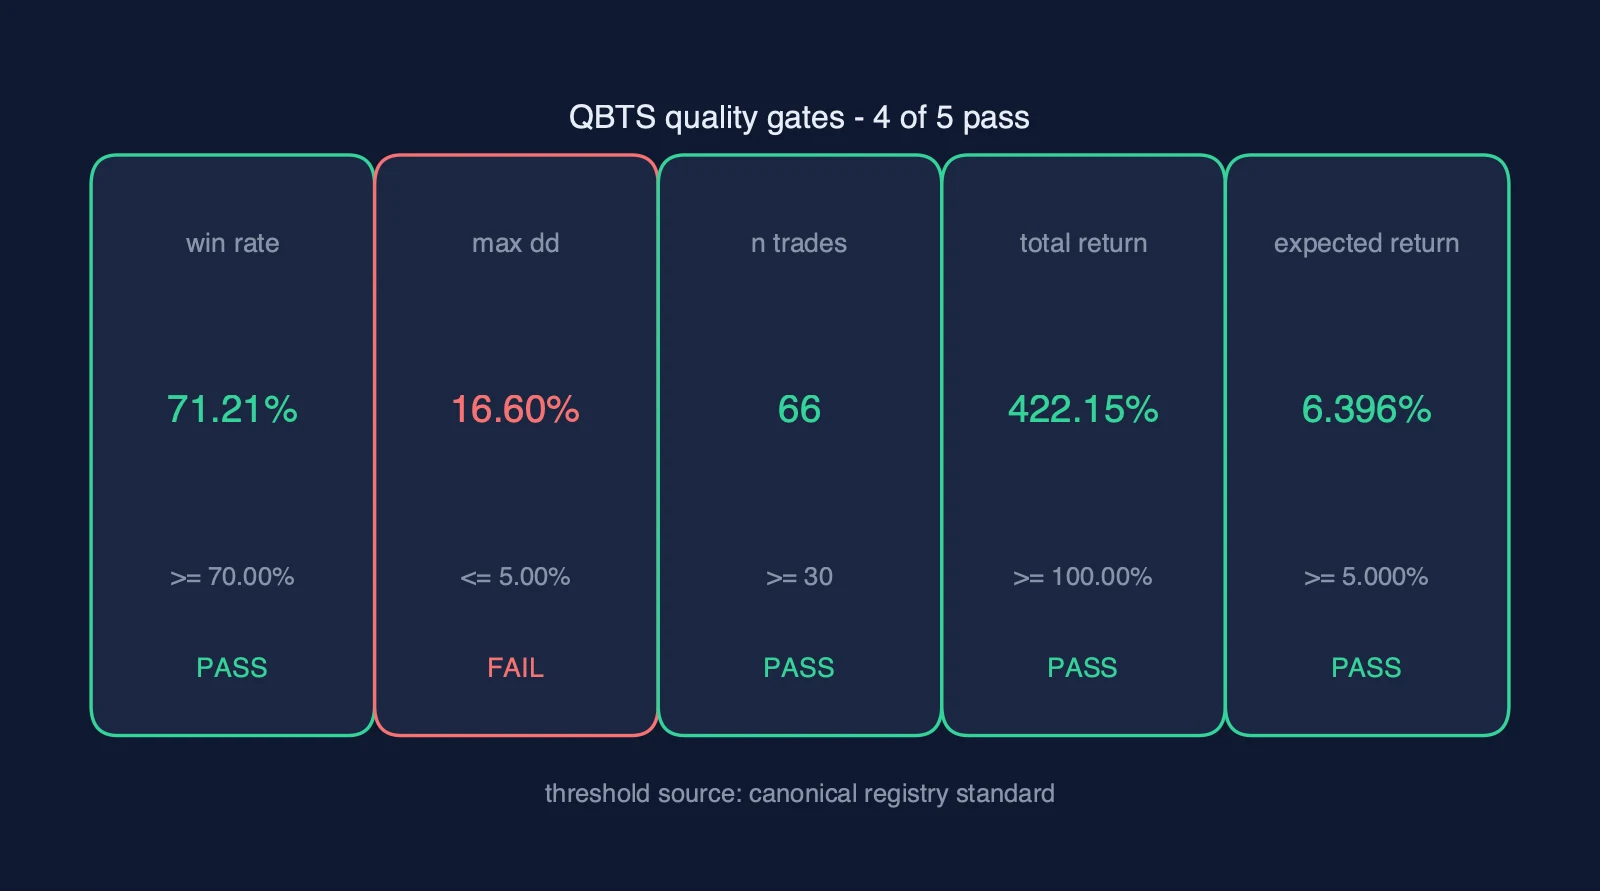
| win rate | 71.21% | >= 70.00% | pass | canonical registry standard (model seed: 75.00%) |
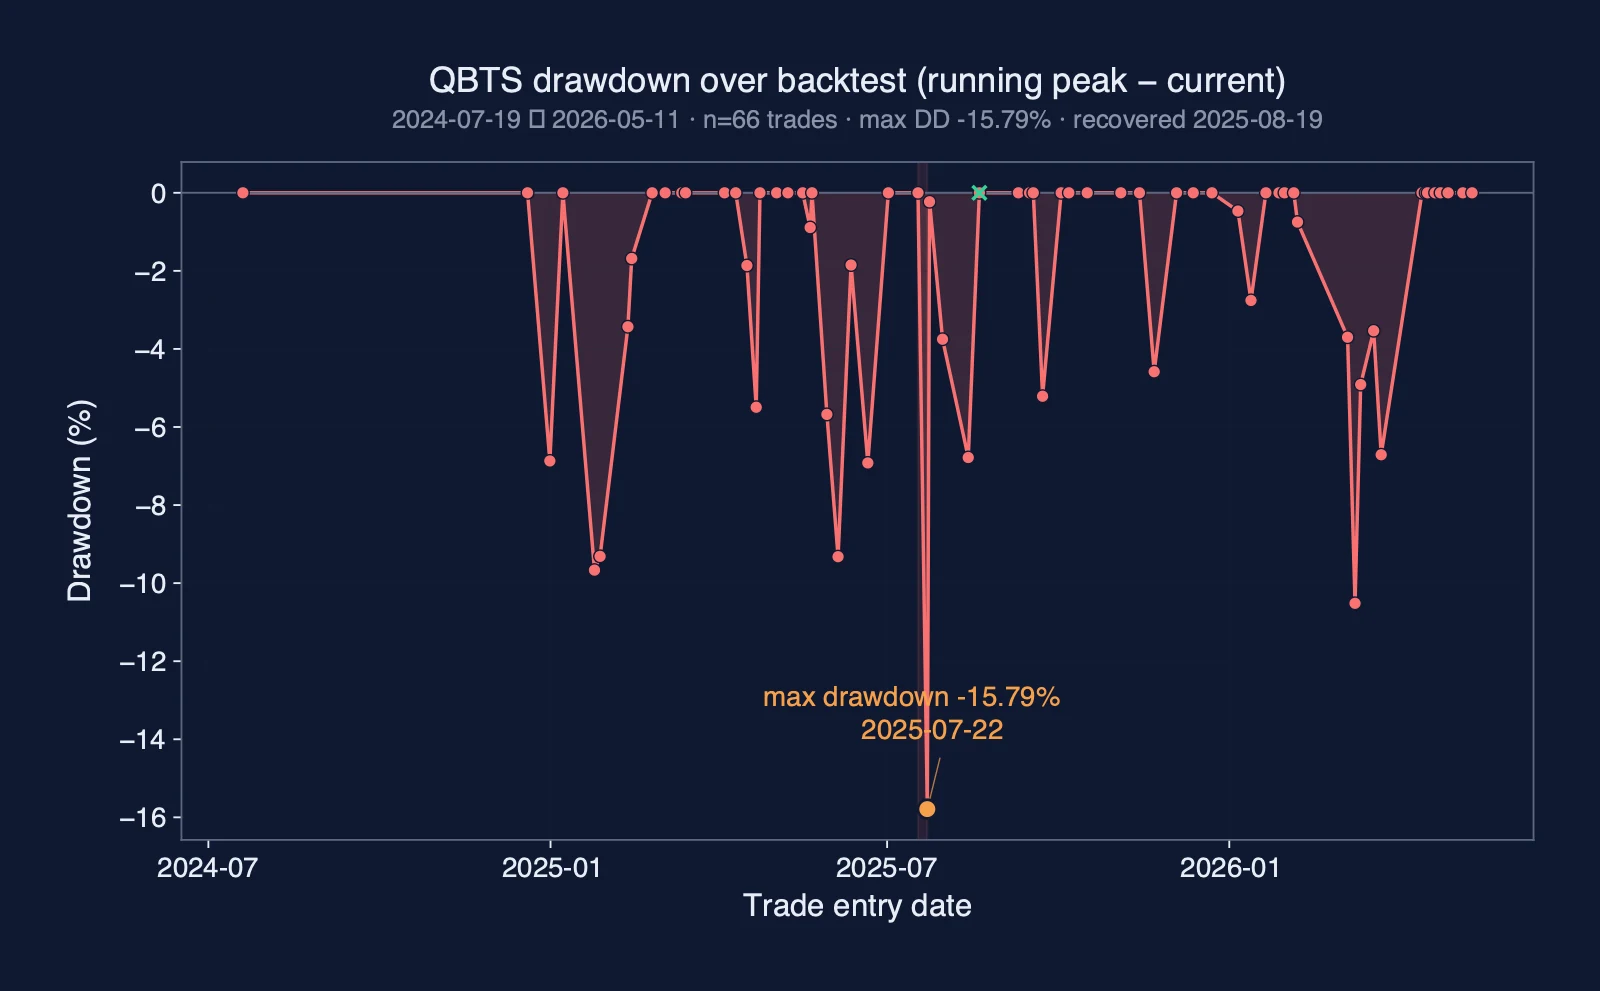
| max drawdown | 16.60% | <= 5.00% | fail | canonical registry standard |
| sample size | 66 | >= 30 | pass | canonical registry standard |
| total return | 422.15% | >= 100.00% | pass | canonical registry standard |
| expected return | 6.396% | >= 5.000% | pass | canonical registry standard |
| Metric | Value |
|---|---|
| Total return | 422% |
| Win rate | 71.2% |
| Max drawdown | 16.6% |
| Expected per trade | 6.40% |
| Trades | 66 |
These figures come from the model's backtest. The backtest uses modelled backtest conditions and quality-gated acceptance.
Walk-forward verification
| Metric | Value |
|---|---|
| Walk-forward match | 100% |
| Verified timestamps | 1,659 |
| Signal correlation | 1 |
A trade walked through
The model opened a long position in QBTS at a moment when the prevailing regime was mixed. No clean directional signal had emerged from the broader market. Beneath that noise, the model's own signals told a different story. Conditions had shifted in ways the surface price had not yet reflected. The system moved to capture the gap before the market caught up. The trade closed on a SIGNAL exit. The model stepped out not because anything went wrong. It stepped out because the internal evidence it had been tracking from entry showed the window had closed.
| Metric | Value |
|---|---|
| Direction | long |
| Entry price | 9.36 USD |
| Exit price | 11.36 USD |
| Hold time | 3.9 days |
| Return | +21.37% |
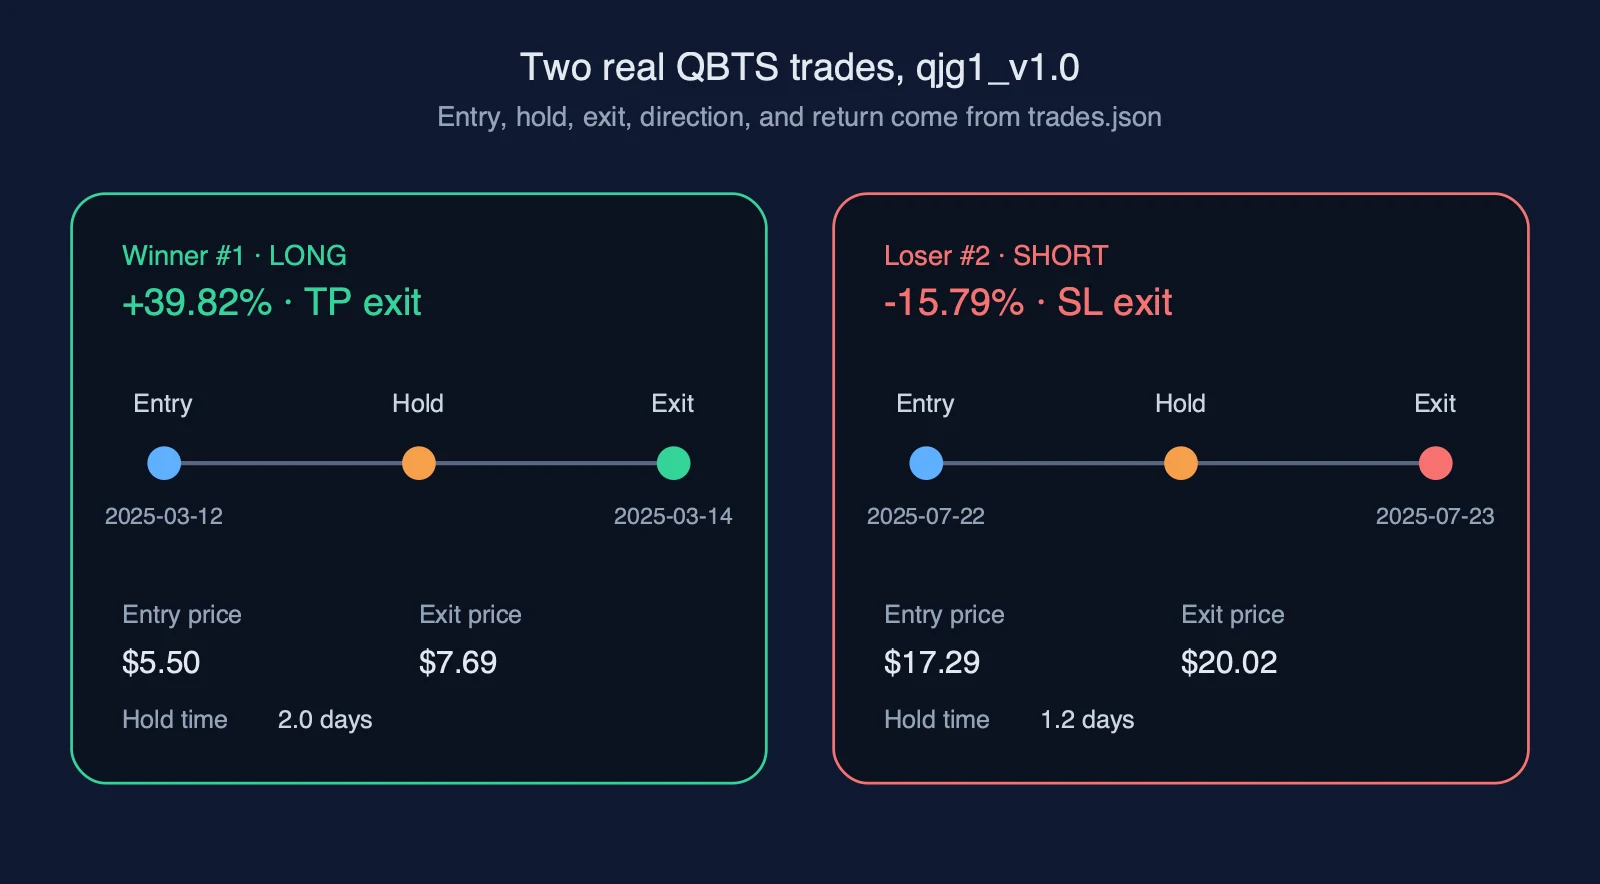
Best trades, walked through
These QBTS examples come from the saved trade file and show the model under different trade outcomes. The section is a review aid, not a forecast.
| Outcome | Direction | Exit type | Return |
|---|---|---|---|
| Fast winner | short | TP | +30.43% |
| Patient winner | short | TO | +15.11% |
| Biggest winner | long | TP | +39.82% |
| Deepest loser | short | SL | -15.79% |
How does this compare to just holding QBTS
Over the same window this model was active, simply buying and holding QBTS would have done more for a portfolio. Following the model's signals did not do as much. That gap matters. When a strategy underperformed a passive hold, active decision-making had a cost. The missed trades, the exits, the entries that did not fire all outweighed any benefit the model brought. The numbers sit in the tiles below. The honest read is that passive exposure to QBTS was the harder benchmark to beat here.
| Metric | Value |
|---|---|
| Model total return | +422.15% |
| Buy-and-hold | +971.88% |
| Difference | -549.73% |
How well does the model reproduce its tape?
Walk-forward verification is the discipline of asking a trading model a simple but demanding question: did you learn something real, or did you just memorise the past. The way it works is that the model is trained on one historical window of QBTS price and open interest positioning regime data, then tested on a separate, later window that was deliberately kept out of view during training, so the model has no way to have shaped itself around those particular moves. When the signals the model produces on that unseen stretch of tape align strongly with the actual outcomes that followed each call, it is evidence that the edge is genuine and repeating, not a lucky pattern that happened to fit one era of history and quietly vanished the moment the tape moved on. A reader can think of it as checking whether a model that said one thing in rehearsal still says the same thing on opening night in front of a completely different audience with a different script: a strong alignment tells you the model has genuinely learned the underlying tendency, not just the surface noise of a single market period, and that is the foundation on which every other claim in this analysis rests.
| Metric | Value |
|---|---|
| Match rate | 100.0% |
| Correlation | 1.000 |
| Alignment | Drifting |
When a model is described as drifting, it means the live QBTS trades the desk runs today are behaving differently. They differ from the historical pattern the model was built on. The signals are still firing in the expected directions. But the market is no longer responding the way the backtest recorded. Returns arrive at unexpected times, in unexpected sizes, or not at all. The gap between what the model expected and what actually happened is wide enough to matter. A drifting read is a signal desks typically weigh when judging position size: pushing full exposure into a regime where the model's underlying edge is weakening is the kind of condition that turns mild underperformance into real drawdown. When the model reads as aligned, live behaviour is tracking the backtest distribution closely enough that the historical edge appears intact, and the gap between expected and realised outcomes is narrow. Quiet simply means not enough live trades have accumulated yet to form a reliable verdict; the positioning footprint in this state warrants the same attentiveness as the earliest signs of drift.
When this approach fails
The open interest positioning regime approach that drives this model works well in trending, committed markets. But it has well-defined environments where it tends to work against itself. Knowing them gives a more complete and honest picture of what to expect. In choppy, indecisive markets where buyers and sellers swap control repeatedly, neither side makes a sustained commitment. The model can enter on signals that dissolve almost immediately. A series of small losses accumulates before any meaningful move materializes. Sometimes price gaps sharply around a major catalyst, jumping clean past the level where the model intended to exit. The loss on that trade can land considerably larger than what a typical losing trade looks like under calmer conditions. The most disorienting scenario is a genuine regime shift. The relationship between positioning and subsequent price behavior that held for an extended stretch simply stops applying. The underlying character of the market has changed in a fundamental way. In those moments, the model keeps expressing a view built on a pattern that no longer fits what QBTS is actually doing. It can take meaningful time before enough evidence builds up to signal that the old logic has lost its footing.
| Metric | Value |
|---|---|
| Losing trades | 19 |
| Worst single-trade return | -15.79% |
| Worst in-trade drawdown | -16.60% |
In a live deployment of this model on QBTS, the primary monitoring focus is intraday drawdown, specifically whether it is tracking inside the range the model was built to tolerate. If realised losses are growing faster than the backtest distribution would consider normal for the current regime, that divergence is the indicator desks weigh when reassessing size or pausing the strategy; averaging into a drifting model is a known path to compounding the loss. Borrow availability and the cost of financing short positions also deserve regular attention. A sudden tightening in locate supply or a spike in borrow fees erodes the positioning edge; an edge that disappears on the cost side is observationally indistinguishable from a model that has stopped working. Finally, scheduled macro events (a rate decision, a policy statement, an earnings release from a name that moves QBTS in sympathy) are the kind of gap risk that was not present in the backtest tape, and holding through them means accepting exposure the model was never sized for.
Risk and honest limits
The model runs through a verification pipeline at each release. Its current status shows in the deployment lifecycle below.
Lifecycle
Where we are
This snapshot shows the model's current deployment state. Live trades are building up. As they do, the live performance section will replace the placeholder figures.
Sources
This article is based on Stonewell One research, including backtesting, walk-forward verification, deployment monitoring, and model-risk review.