The Volatility Surface Archetype: reading the shape of the options surface, not the price, to infer direction
It reads the level and shape of the options volatility surface, centered on the term structure of implied volatility and how it is moving, and a fixed rule-based read turns that shape into a stance of long, short, or standing aside.
Method archetype

Two markets at the same price can be bracing for very different things. What separates them is not the price; it is how the options market is pricing protection across expiries and strikes, and how that picture is leaning. This archetype reads that picture, the volatility surface, and treats its shape as the evidence. Price is only the thing the surface is leaning on.
What makes this its own discipline is that the read is a shape, not a single number. The method characterizes the level and shape of the surface, judges it against its own recent history, and lets a fixed rule turn that shape into a stance. It reads a landscape rather than a line, and most of the time the landscape is not leaning clearly enough to act on. The sections below walk that read from the surface to the trade.

What it reads: the surface and its shape
The volatility surface has a vocabulary of shape. The load-bearing read for this archetype is the term structure: how protection is priced across nearer versus further expiries, whether that profile is steep or flat, and which way it is moving. The surface also carries skew, the balance between downside and upside protection, and curvature across strikes. Those are part of what the scan takes in as context, not separate switches that each have to fire before the method can act.
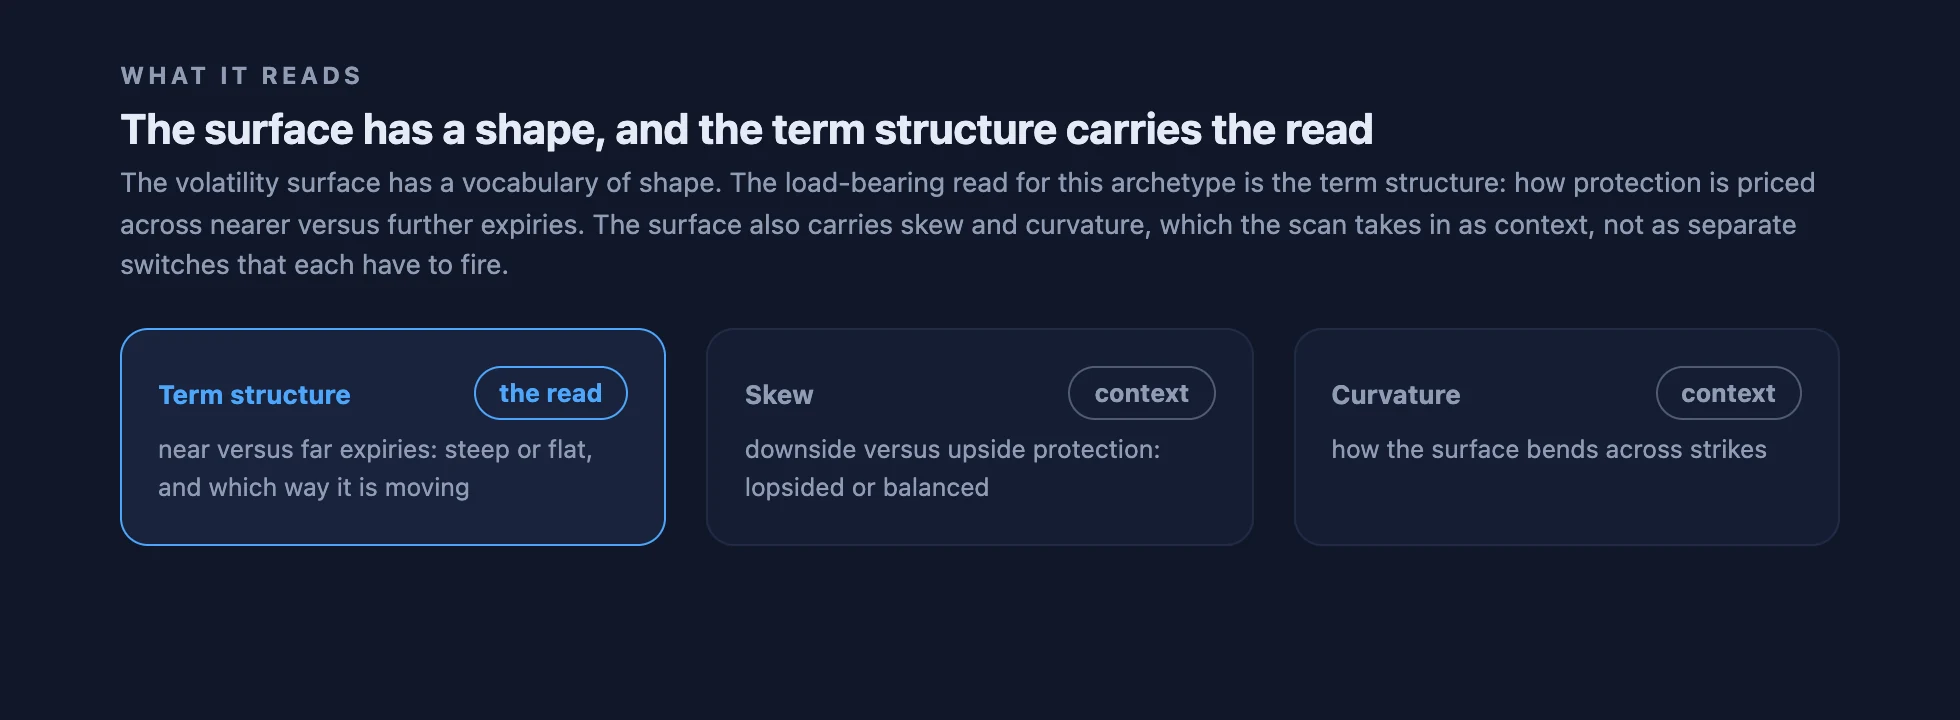
Steep or flat, and which way it is moving
The read is a shape rather than a single reading. A steep term structure leans one way, a flat one another, and what carries the signal is how that shape compares with its own recent history and which way it is moving, not a one-off snapshot. Because the comparison is to the surface's own recent behavior, a market whose surface is always somewhat steep is read by the change in its shape, not by the raw level.

Why the shape is read against its own history
Surfaces differ from one market to the next, and some are structurally steeper than others. Judging the current shape against its own recent history is what lets the same method work across markets without a separate rulebook for each: it asks whether the surface is unusually steep or flat for itself lately, and which way it is moving, rather than comparing against any fixed outside level.
From shape to stance
The surface shape is the evidence; the stance is the read. A fixed rule-based regime read takes the current shape and resolves it into one of three stances: a directional-up lean becomes a long, a directional-down lean becomes a short, and a surface that is not leaning clearly keeps the method flat. This is a rule rather than a trader's judgement, and it is a single directional read, not an elaborate engine sorting the market into many states.

When it stands aside
A directional read does not by itself open a trade. Several filters each remove a different kind of ambiguity, and a position opens only when all of them clear. The shape must actually be leaning rather than neutral or half-formed; the move the surface implies has to be large enough to be worth the round-trip cost; the read has to have held over a prior look-back rather than just snapping into place; and the regime must not be reversing from the period before. Because every filter can veto, the method spends much of its time flat, and that standing aside is a decision rather than a gap.

Managing the trade
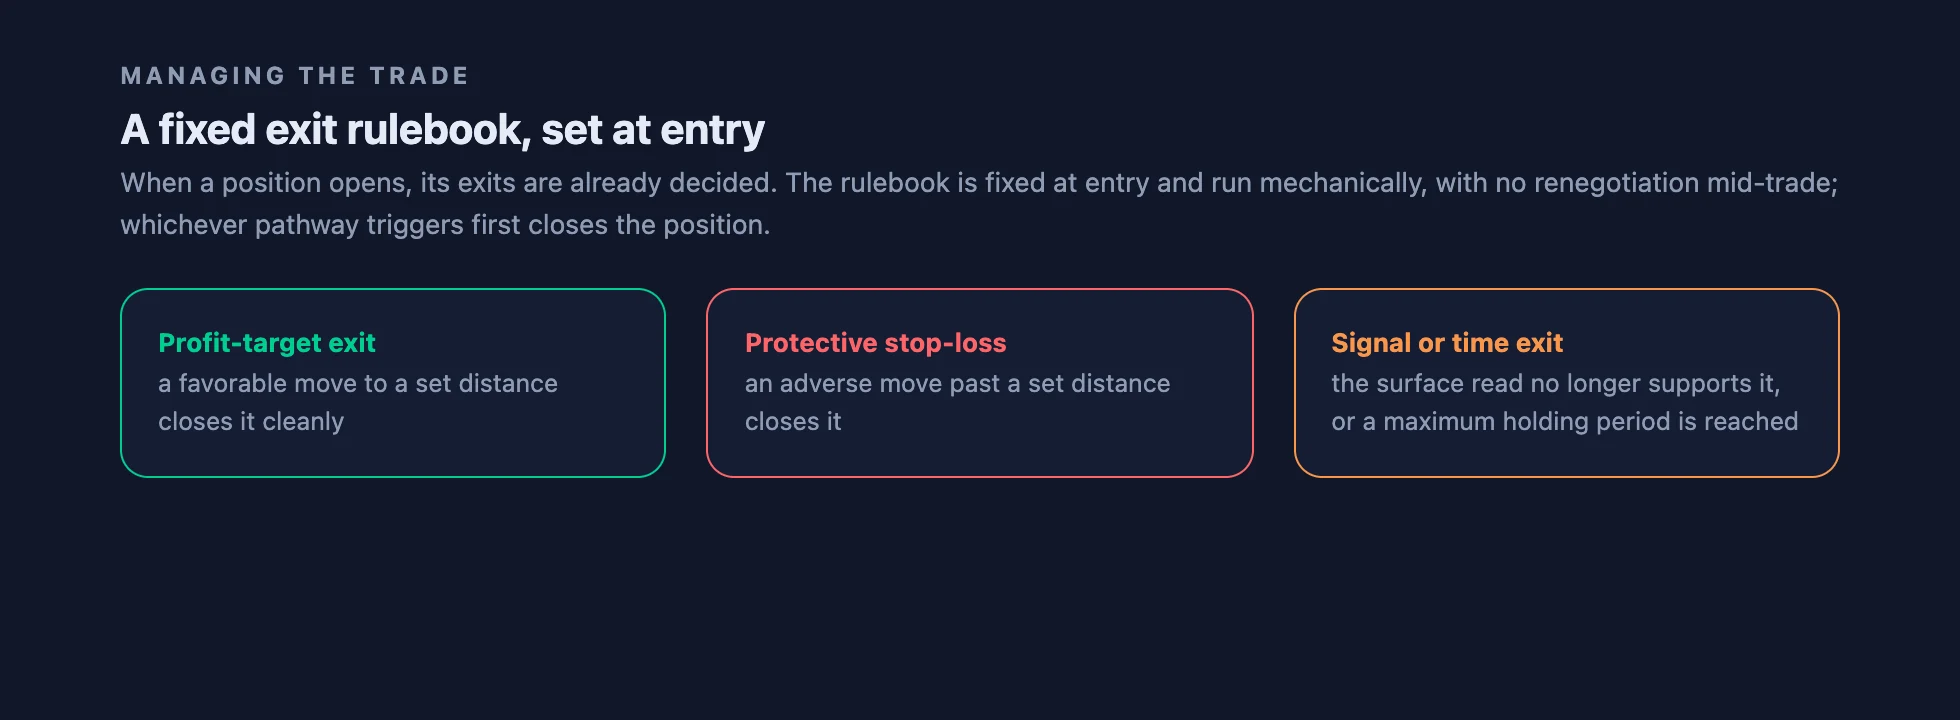
When a position opens its exits are already decided. The rulebook is fixed at entry and run mechanically, with no renegotiation mid-trade: a profit-target exit at a set favorable distance, a protective stop-loss exit at a set adverse distance, and a signal or time-based exit when the surface read no longer supports the position or a maximum holding period is reached. Whichever pathway triggers first closes the trade, and the method records which one did.
How to read it on the dashboard

How it is validated

Walk-forward verification trains the rule on an older slice of history and asks it to predict an unseen later slice, then compares its calls with what the market actually did. A close match means the surface read reproduced on unseen data, and stable error means even the wrong calls were small and well-behaved. That is a test of whether the signal reproduces out of sample, not a claim that it made money. The result is scored against a fixed acceptance panel, and this exemplar cleared only part of it, so its evidence is partial and a backtest is not a record of live performance.
What this archetype is not
- Not a price or candle read: its evidence is the options surface and how it moves, not the price tape, the closes, or the order book.
- Not a single-indicator switch: it reads the level and shape of the surface across expiries, not one number crossing a line.
- Not a percentile rank: it does not rank a value into a band or ladder; that is the percentile-regime family.
- Not the reversion-onset method: that standardizes one input and waits for the onset of a turn; this reads the shape of the whole surface and synthesizes a directional regime.
- Not the put-skew method: that reads one downside-protection slice as a regime and confirms it with a second read; this reads the surface's broader shape, led by the term structure.
- Not a volatility forecast: it does not predict how volatile the market will be; it infers a direction from the surface's shape.
- Not tied to one instrument: the method is a fixed family identity independent of which market it reads.
Reusable across instruments
What makes this an archetype rather than a single trade is that it is defined by how it reads, the shape of the surface, not by which market it reads. Point the same method at a different instrument and the recipe is unchanged: characterize the surface shape against its own recent history, turn the shape into a directional read with a fixed rule, stand aside unless the filters clear, and manage the position with a pre-set exit rulebook. The documented model is one instantiation of that template, and its regime orientation and holding horizon are read from its own behavior, not inherited from the family.
Specific models built on this archetype, with their benchmarks, are listed in the catalog. The archetype itself is a method, not any one of those models.
This explainer describes a method, not a recommendation, and a model built this way is not a guarantee of future results. It is a disciplined way of reading the shape of the options surface, and acting only when that shape leans clearly enough to be worth it.
Sources
This article is based on Stonewell One research, including backtesting, walk-forward verification, deployment monitoring, and model-risk review.